Getting to the bottom of Vancouver’s green spaces: A review of green space metrics

Getting to the bottom of Vancouver’s green spaces: A review of green space metrics
By Selina Bull, VPSN board member
Back in 2011, the City of Vancouver announced its goal of becoming the greenest city in the world by 2020. The City’s Greenest City Action Plan 2020 is the roadmap to getting there, outlining 10 goal areas and 15 measurable targets. The original 2011 plan has since been updated, but the core goals and strategies remain.
The plan’s goals go beyond addressing climate and sustainability issues, they recognize the health benefits associated with access to nature and green space: “Whether they take the form of a community garden, a city park, a greenway along your block, or the seawall, green spaces have been shown to benefit our physical and emotional health by reducing blood pressure, cholesterol, and stress. These spaces also contribute to our sense of community by creating places for recreational activities, for children to play, and for neighbours to meet and socialize.” (Greenest City Action Plan Part Two: 2015-2020)
One of the key targets set out in the plan is to have all Vancouver residents living within a five-minute walk of a park, greenway or other green space by 2020. The indicator chosen to measure this is the percentage of total city land that is within a five-minute walk, defined as a 400-metre radius, of a green space. When you measure the five minute access to city’s parks and green spaces, you will get a map that looks something like this:
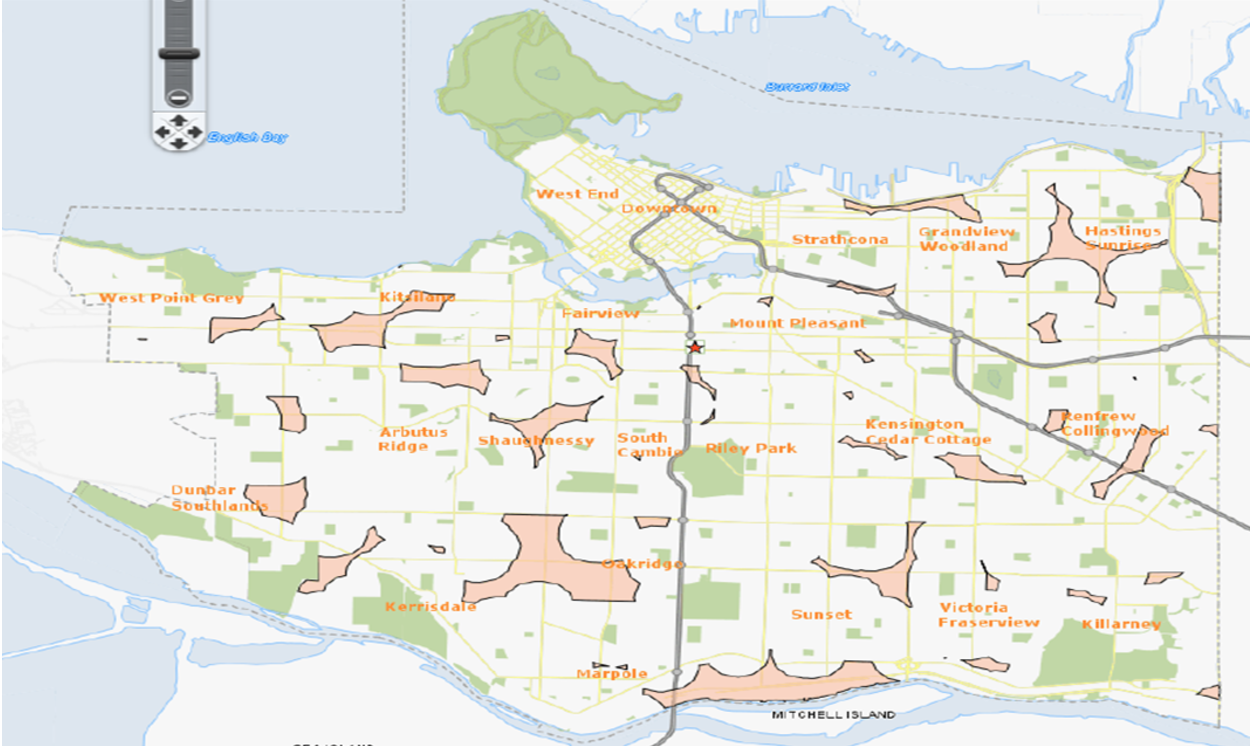
This City of Vancouver map shows access to green spaces (Vancouver Board of Parks and Recreation)
How close are we to meeting this target??
Well, we’re actually pretty close. As of 2014 we’re about 92.7% of the way there! (That is to say that 92.7 percent of Vancouver is within 400 meters of a park, greenway, or other greenspace). This is encouraging. After all, scholarly and anecdotal research suggest that a person’s proximity to a given park relates directly to how much he/she will use it and, likewise, the more parks you have nearby, the more opportunities you have to use a park. But before we celebrate our amazing progress in solving this problem perhaps we ought to ask: to what extent was this a problem in the first place?
The answer: it wasn’t, really. The baseline measured in 2010 was already 92.6 percent.
There are two important questions to ask here: “Is this the best way to measure green space?” and “What counts towards the total of green space?” (In the case of the “Shrink the Pink” map, parks, greenways, community gardens count all count towards the total.)
With respect to the first question, there are many different ways to measure green spaces for planning purposes. For example, Vancouver’s very first city plan—the 1928 Bartholomew Plan —compared the number of park acres to the population of an area. The metric used was persons per park acre. Harland Bartholomew and Associates recommended approximately one acre for every 100 persons in the city. Since then, the method of comparing park area to population has stuck, often used as an informal metric for assessing “park rich” versus “park deficient” neighbourhoods. It’s important to note, though, that the specific proportion that Bartholomew recommended has changed over time.
Looking at area per capita or the inverse, population per unit of area, can give us important information about how many people are served by a certain amount of green space. If you look at the green space per capita (or per 1000 persons) in a neighbourhood and compare it against a larger area, such as green space per capita in the whole city, you can see how one neighbourhood stacks up against one another or the city-wide average. (See, for example, the map below.) This type of tool helps planners and policy makers work towards equitable distribution of green space among the population.

This VPSN map shows the different levels of open space compared with the population of each neighbourhood (VPSN)
As park space per capita metrics typically rely on census statistics, the focus indirectly tilts towards residential population figures. This makes sense on one level; however, the daytime and nighttime population of neighbourhoods can change dramatically depending on employment and other occupational patterns. Or put another way around: isn’t it also important to make sure there are parks and greenspaces near employment centres as well?
The Bartholomew plan also recommends that a neighbourhood park “should be within walking distance (considered to be a half-mile) of practically every person in the city.” This is close to the metric mentioned above regarding the Greenest City Action Plan. One issue with this metric is that it doesn’t measure population density. It doesn’t differentiate between a neighbourhood with high demand for green space (e.g., heavily populated area whose residents live mostly within the prescribed radius from, say, several small neighbourhood parks) and a neighbourhood with lower demand for green space (such as a sparsely populated area whose residents live within the radius of several small neighbourhood parks or even a sparsely populated area with large parks). A recent Park Board study (Parks Provision Standard and Metrics Study: Network-Based Assessment of Access) takes a deeper dive into this issue of green space access in Vancouver. Based on a model that estimates various elements of the pedestrian environment (such as slope, stairs, busy streets, local streets and controlled/uncontrolled stoplights), the study assesses pedestrian access to green space in a more practical and realistic way. However, as noted above, this measure does not differentiate between areas of high and low demand for green space. Equally importantly, it does not speak to quality of green space.
This takes the question of measurement in a different, but fundamentally important direction. Qualitative aspects of green space are a significant driver for the actual use of the space, as well as the health and wellbeing benefits derived from green space. A focus on quality also suggests that it actually doesn’t matter how close you are to green space, or how much of it exists per capita, if the space in question isn’t usable, is poor quality, unsafe, lacking in amenity.
Measures of quality could consider one or more indicators shown by research to produce key health and wellbeing benefits, such as safety, accessibility, noise, biodiversity, aesthetics, recreational space, canopy cover, spaciousness, historical or cultural associations, etc., although these may differ from place to place or even between demographic groups.
The moral of the story, though, is that each approach to measurement reveals different aspects of the park and greenspace “situation” in Vancouver. And as with many things, focusing on a single measure may have its limitations.
What counts?
The second important question noted above is “what counts towards the total?” A lot depends on what you choose to measure and map. The percentage of coverage that I’ve noted above can be mapped out by drawing a 400-metre buffer around these green spaces.
From the “Shrink the Pink” map above, you can see that there are a few stubborn pink areas that are not within a five-minute walk of any green space.
In this “Shrink the Pink” map, green space includes public community gardens, city parks, greenways, and some public school grounds. As you see, it does not include any private green space, leaving the residents of some west side neighborhoods that likely do have access to private green space “in the pink.”
And while some of the City’s greenways such as the Arbutus Greenway [I’ll insert a link here] are leafy, verdant and quiet, not all measure up in quality. For example, the Central Valley Greenway runs from the Olympic Village along First Avenue and then along Great Northern Way, does a slight jog near the VCC–Clark station on the Millennium Line and then joins North Grandview Highway, where it runs alongside the SkyTrain tracks out to Burnaby and beyond. There are certainly lots of very green spaces along this greenway, but other parts of it (such as Great Northern Way) don’t feel all that green.
It is also important to consider green spaces that support a diversity of users and uses. While it is helpful to look at green space in the aggregate (all types compiled—such as the Shrink the Pink map), there should also be an opportunity to measure different types of green space separately. For example, the types of green spaces that serve seniors may be different from the types of green spaces that serve young children. Another example: greenways serve transportation and exercise uses but are not successful as gathering spaces. Some may even consider that the inclusion of greenways that are zoned as transportation corridors towards the green space total may be an overly broad definition of green space.
Lastly, the measure of quality also has its constraints. The broad range of potential indicators points to a difficulty with measuring quality: it is not clearly or consistently defined, is often somewhat subjective, and can pose a challenge for measurement. In terms of a more generalized approach, one potential way around this is to measure user satisfaction. It’s not perfect, and while user satisfaction is a personal measure, it may, nevertheless, help address quality, since quality could be perceived differently from person to person or from neighbourhood to neighbourhood. A number of cities across Canada – and beyond – use this approach, usually administering it through an annual or semi-annual survey.
What’s next?
The Vancouver Park Board recently launched its year-long parks and recreation master plan process, called VanPlay. As part of this, the Park Board has also been looking at the question of park measures and metrics. It will be interesting to see how they choose to tackle this matter, as we’ve already seen, each of the measures identified above has merits and limitations. One way forward is to think about regular updates on a combination of metrics – for example, in a fashion similar to the one employed in Los Angeles County.

This infographic shows different green space metrics applied in Los Angeles County
Still other, more nuanced metrics may be developed – and we’ll look forward to exploring those further if and when that happens.
In the meantime, we would encourage you to get involved in the VanPlay conversation. We’re looking forward to a process that (hopefully) balances consideration of density, demand, quality and user satisfaction as well as access, rather than focusing on one or even two of these measures. You can look forward to more on the VanPlay initiative in our future posts.
We want to hear from you!
We’re running a survey about your use of green and open spaces. We’d love for you to participate by clicking here.